

QC-CALC SPC Reports
This software is designed to analyze the data collected by QC-CALC Real-Time and QC-Gage. Use QC-CALC SPC's charts and reports to constantly monitor your process and keep it in control.
QC-CALC SPC offers a wide variety of charts and functions to aid your analysis and give you the power to make on-the-spot decisions. In seconds, QC-CALC SPC gives you a precise picture of how your production line is performing with easy-to-use menus.
Key Benefits
- Control Charts
- Process capability charts
- Attribute Charts
- Ability to print reports direct to PDF
- Ability to email reports
- 21 CFR Part 11 compliant
- Record and dimension filtering
- Remote Real-Time monitoring capability
- Multiple database grouping capability
- Built-in report designer
- Built-in password protection
How it Works...
QC-CALC Real-Time reads CMM and gage data and saves it to the network database making the results available to QC-CALC SPC. QC-CALC SPC opens the same database from your office or other remote location. As data is collected, your SPC plots are continuously updated to show you live results from the shop floor. QC-CALC SPC can then filter the data and run charts and reports giving you full control.
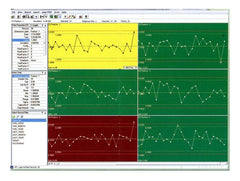
Monitoring
Monitoring allows you to watch the data live on one computer as parts are being inspected on another. As your CMM runs, QC-CALC Real-Time is updating its live screens while QC-CALC SPC displays the same data in another location. This means you have the ability to see the condition of your inspected parts in real-time from your office or even at the machining center. You can monitor a single file, a group of files, or the inspection machine itself. You can also choose to view the data in either live plots or in spreadsheet form.
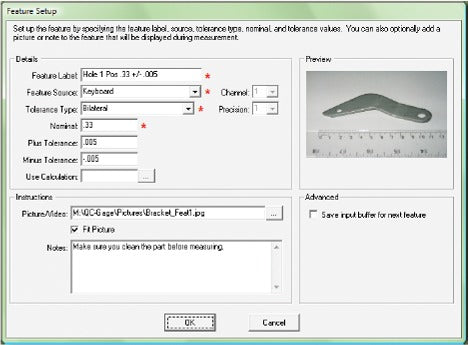
Dimension Filtering
Dimension filtering allows you to create and save different combinations of dimension filters providing a quick view of critical features. Dynamic dimension filtering allows you to see only features that are trending, out of specification, or out of control.
Shop now for QC-CALC SPC Report Software
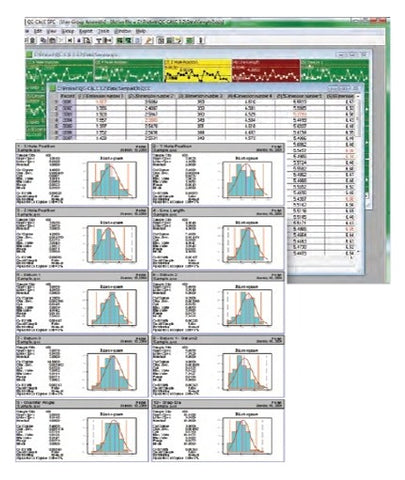
ReportingReporting in QC-CALC SPC allows you to analyze the data and print your charts to a printer, print preview, or to a file. The following report types are available... |
 |
|
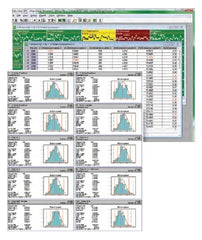
Control Charts
|
|
|
Process Charts
|
|
|
| Shop now for QC-CALC SPC Software |
Download 30 Day Free Trial... Click Here |
Related Links
QC-CALC Real-Time
This module is used to collect and display measurement results from all CMMs, Video CMMs, and hand gages without operator intervention. You can create reports and export data to spreadsheets, databases, and other SPC programs. This means you can transfer data from all of your measurement devices to any SPC package using one program!
This is the first program to provide one interface for all machines and one interface for all outputs. Prolink's goal is to make your data collection seamless no matter what equipment you’ve purchased or software you use.
Click Here for more QC-CALC Real-Time information
Shop now for QC-CALC Real-Time

QC-CALC GageStation
GageStation is a combination license of both QC-Gage and QC-CALC Real-Time. This combination license creates 1 data collection station.
QC-Gage is a full-featured data collection application for use with hand-held gages. The software allows inspectors to enter measurement data by keyboard or through a direct connection to one or more gages. It displays this data both graphically and in table form, and automatically interfaces with QC-CALC Real-Time. By using GageStation, you can identify and isolate out-of-conformance parts.
Click Here for more QC-CALC GageStation information
Shop now for QC-CALC GageStation

QC-CALC Office Buddy
SPC Office Buddy integrates directly with Minitab, JMP and MS Excel to run reports using the data that was collected on your CMM, Vision System, and at your Gage Stations. Office Buddy will allow you to run Minitab reports with the click of a button.
SPC Office Buddy also has the ability to create custom reports in MS Excel. Without using any Excel macros, Excel Jobs addresses the periodic weekly or monthly reports, such as PPAPs, that are very labor-intensive, time-consuming activities.
Click Here for more QC-CALC Office Buddy information
Shop now for QC-CALC Office Buddy
QC-CALC SPC Reporting Software
This software is designed to analyze the data collected by QC-CALC Real-Time and QC-Gage. Use QC-CALC SPC's charts and reports to constantly monitor your process and keep it in control.
QC-CALC SPC offers a wide variety of charts and functions to aid your analysis and give you the power to make on-the-spot decisions. In seconds, QC-CALC SPC gives you a precise picture of how your production line is performing with easy-to-use menus.
Click Here for more QC-CALC SPC Reports information
Shop now for QC-CALC SPC

QC-CALC EDL - Enterprise Data Loader
If you would like to have your data saved in an SQL database for advanced reporting purposes, you will need QC-CALC's Enterprise Data Loader, or EDL.
The Enterprise Data Loader (EDL) typically resides on a central server at each plant and is responsible for synchronizing data from QC-CALC with data in a SQL database. EDL is actually two applications; the EDL Client and EDL Load Service. The EDL Client is a normal Windows application that provides a fast and easy way of setting up the loading events for the EDL Load Service. The EDL Load Service moves your CMM and gage inspection results directly into the SQL database at the scheduled frequency.
Shop now for QC-CALC Enterprise Data Loader

QC-CALC ERS - Enterprise Report Scheduler
The reports generated by ERS are designed to provide a rolled-up overview of the quality conditions within your plant or across plants. Rather than simply reporting on one part, you run reports that compare the capability of all features across all parts, cells, or even plants.
To run ERS, you would need Enterprise Data Loader, or EDL, to gather the data that has been collected from your CMMs, Vision Systems, and Gage Stations, and transfer that data to a central SQL database. ERS then generates automated reports that provide an overall view of your factory's performance.
Click Here for more QC-CALC ERS information
Shop now for QC-CALC ERS
|
Click Here |
Click Here |
Click Here |

Need a quote before you can buy? |
|
We understand that often times the customer will need an "official" quote for software like this before they can make a purchase. The link to the right will take you to Prolink's website where you can see all of the software modules available, as well as costs. If you add items to the cart on Prolink's site, you will be given an option to generate a quote that you can save / print out. |
Login to Prolink's website to generate a quote. |